Project Burn
Dashboards are a powerful feature used to quickly support decisions related to a specific client or project.
The goal is to give the user the ability to control processes in a very friendly and comprehensive way.
As a project manager, it is very useful to understand the status of a specific client and control the profitability of each project. This way the PM will have the necessary tools to negotiate with their clients.
There are several dashboards at the project level available in the system that will display different information.
Burn Dashboard
- Select the project you want to analyze;
- Click on the "Burn Dashboard" tab;
- You will find several representations that will show you in a glimpse whether your project is already burned.
Please note that the burn dashboard is based on Forecast versus Real hours.
Time Burn
This representation shows the number of forecasted hours versus number of real hours. Although the graphic is distributed per month, it also shows a sum representation.
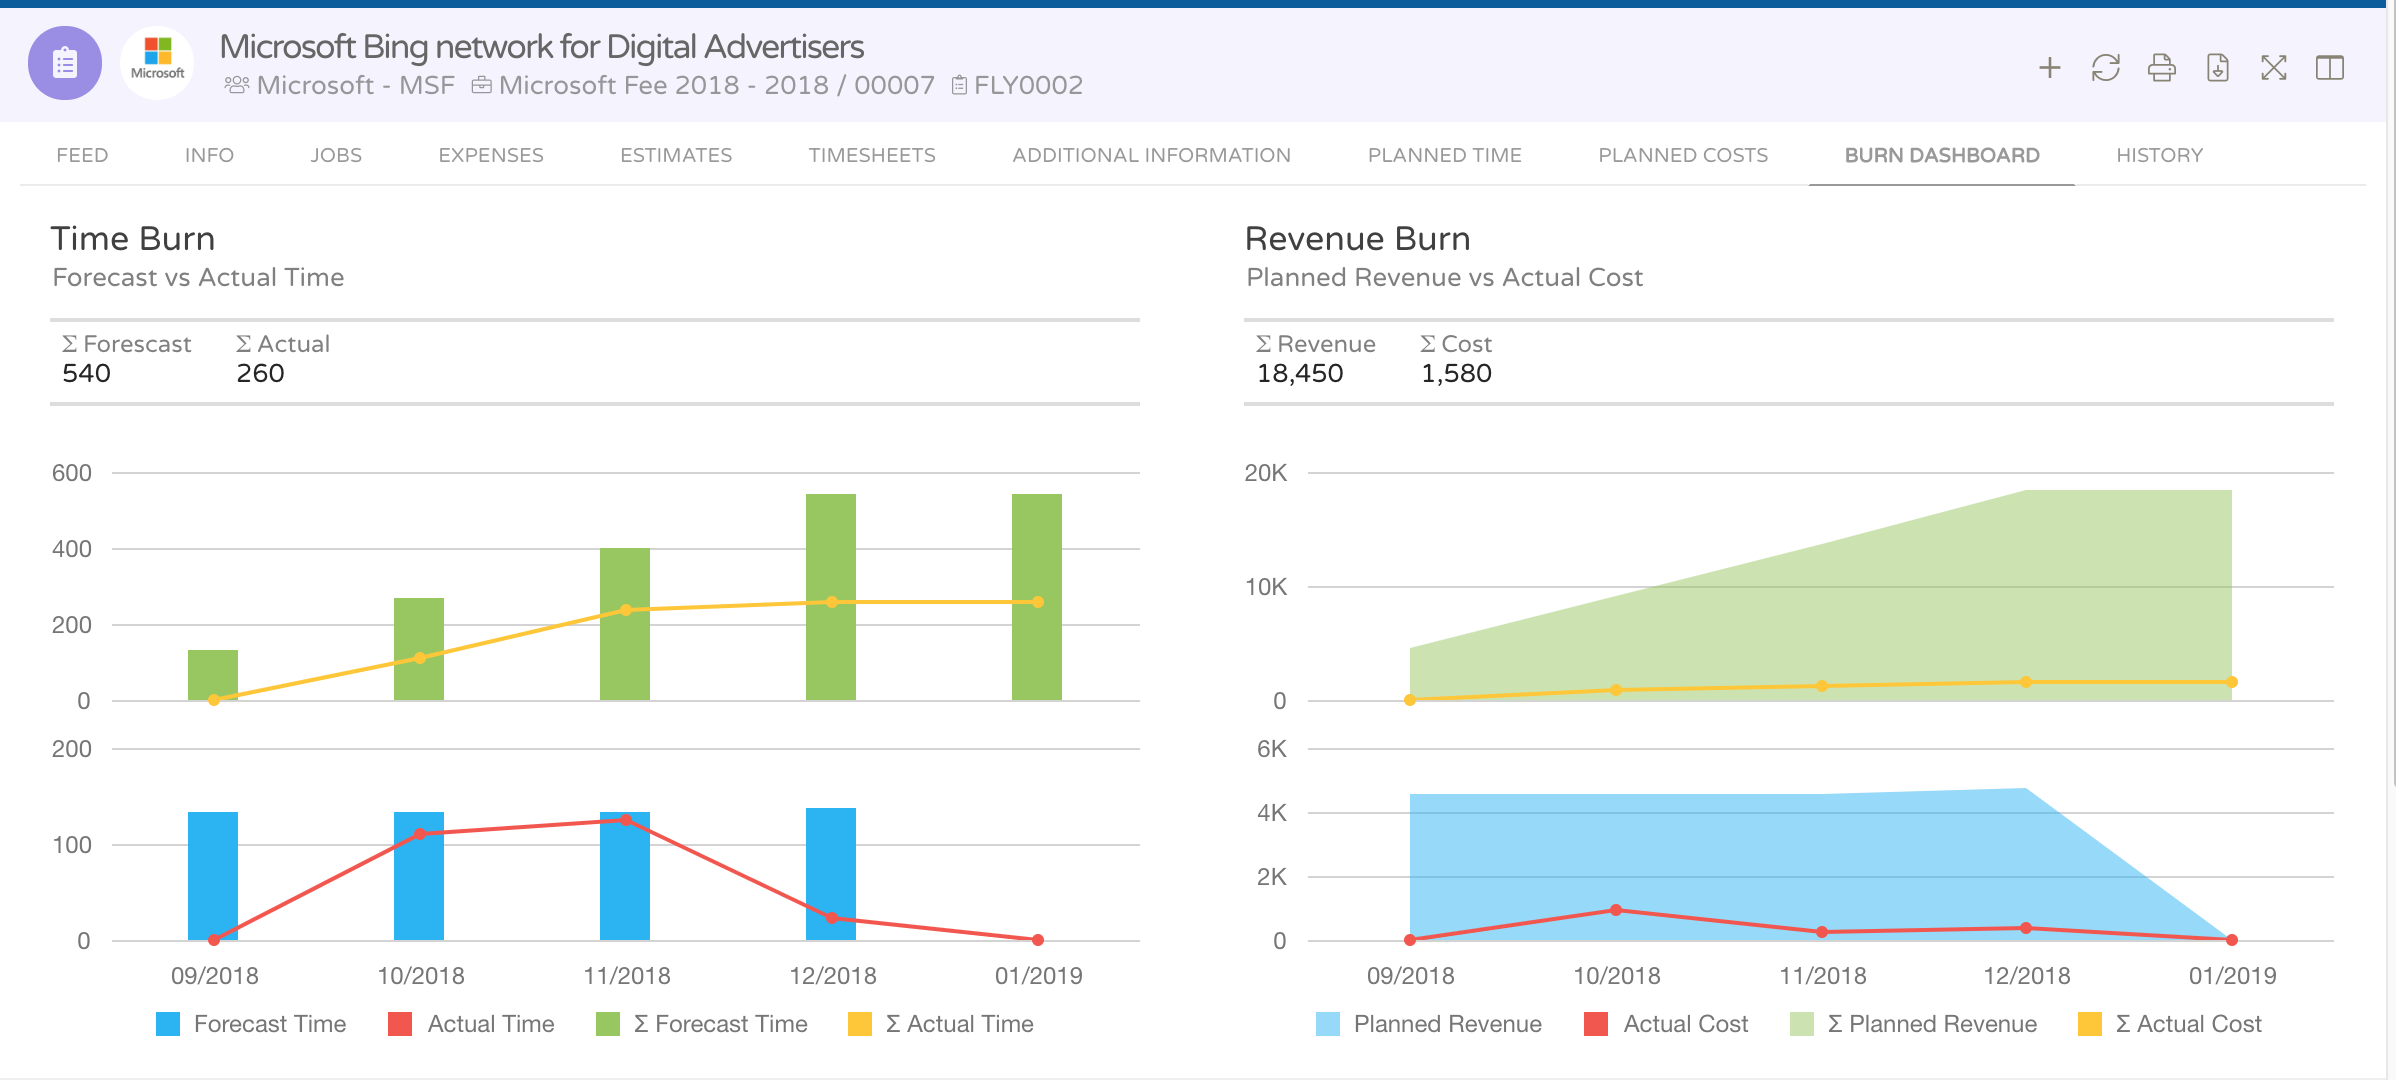
Revenue Burn
This representation shows if the project is already burned in a revenue and costs perspective.
Revenue values are based on planned/contracted hours and the associated value for each typology group. The cost values are inherited by the user cost versus number of real hours filled in.
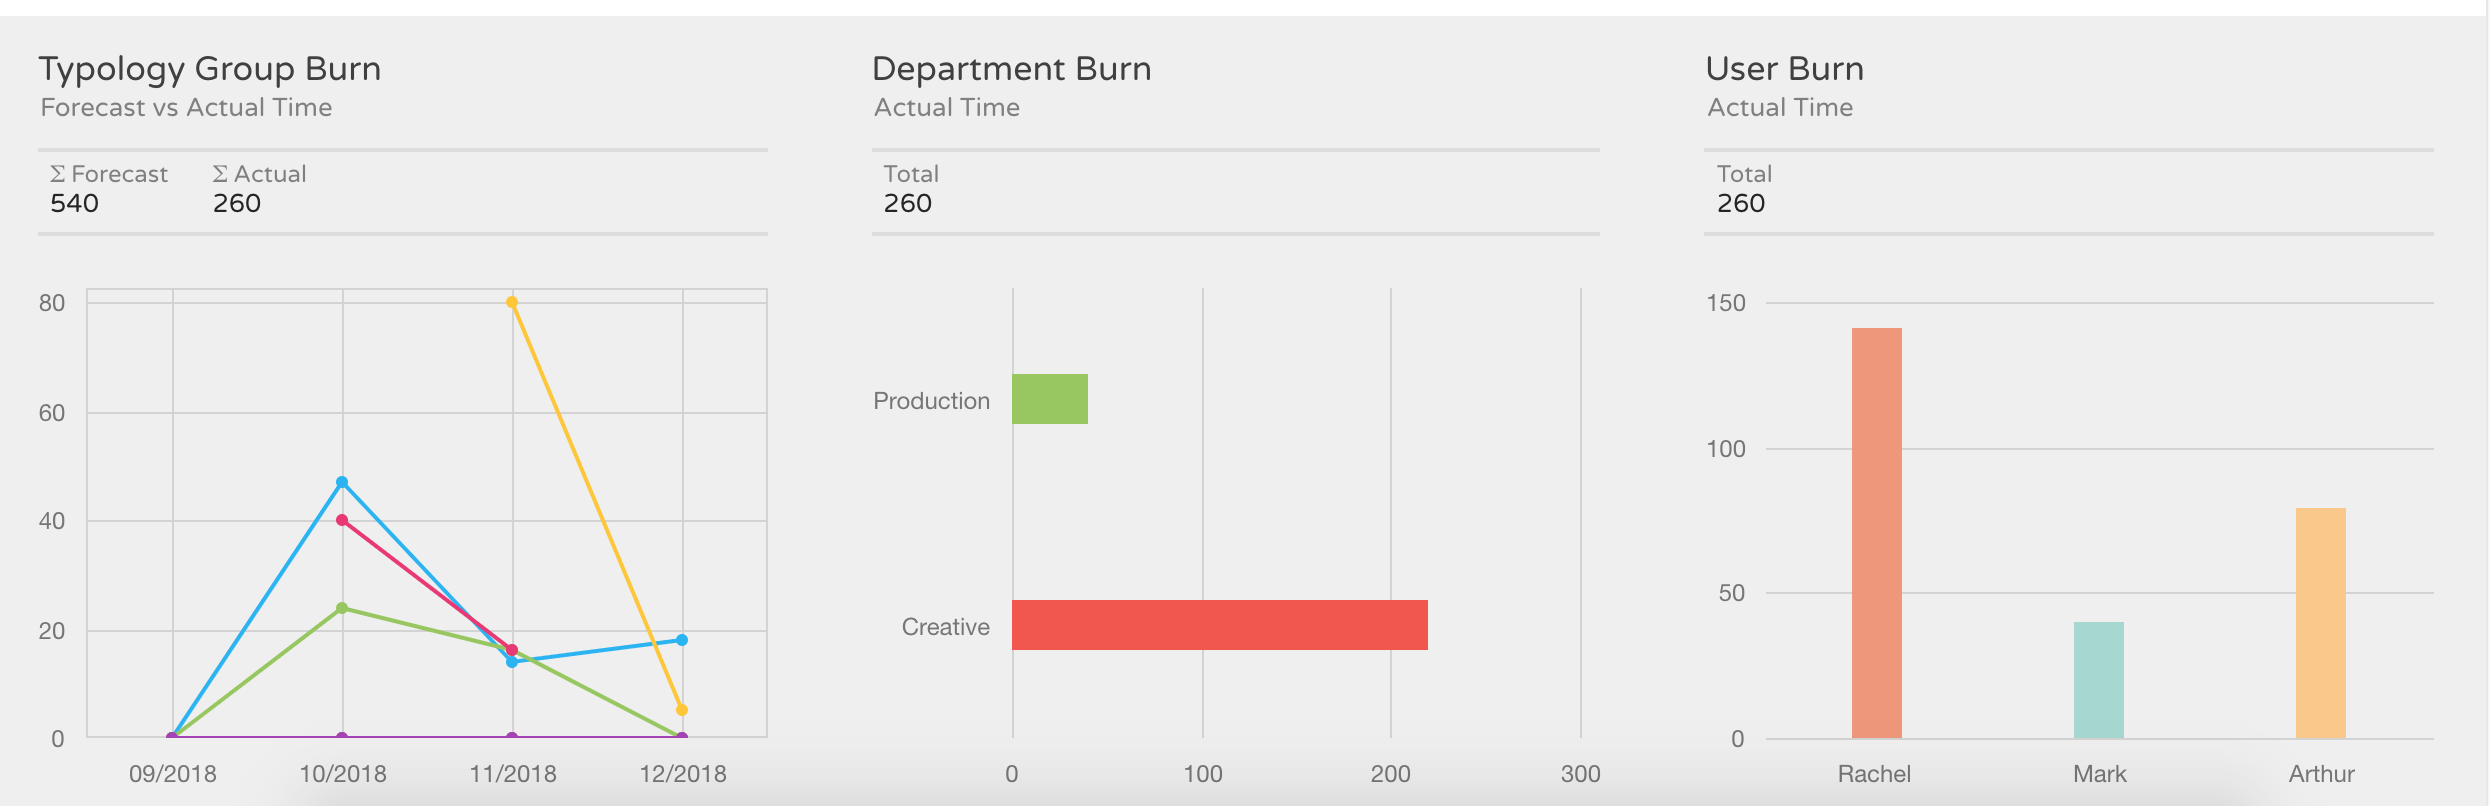
Typology Group Burn
This Dashboard shows which typology is burning your project and is based on actual hours.
Department Burn
This representation is based on the users' actual hours and shows which department is filling in more hours under a specific project.
User Burn
This representation is based on the users' actual hours and shows which user is filling in more hours under a specific project.